• The ceasefire in the Strait of Hormuz has been short lived with dozens of Iranian targets hit with mostly drone attacks for the first time in the war. The US has announced a total blockade on Iran with a 20% toll on goods passing through the Strait in exchange for safe passage.
• Monday markets are lower and risk sentiment falls; equities slide with Antipodean currencies reversing some of last week’s gains.
• Oil pushed above 70.00 per barrel-up 4% to 78.00
• The Fed fears inflation could rise over the coming months as tariff and energy costs balloon.
• Canadian Unemployment drops from 6.6% to 6.5%
• The Bank of Japan (BoJ) raised its 2026 growth forecast and trimmed its inflation outlook based on the Strait of Hormuz opening last week. Markets predict the central bank will hold rates on July 31st at 1.0%
• US Inflation holds centre stage this week when Thursday’s Inflation prints, market expectations are for a dip from 4.2% y/y to 3.8%
• The strongest main board currency over the past 30 days of trading has been the US Dollar (USD) while the worst performing currency has been the Australian Dollar (AUD).

The New Zealand Dollar (NZD) steadied around 0.5650 mid last week against the US Dollar (USD) consolidating around this level Monday in “on again, off again’ risk conditions. The Federal Reserve is still hawkish although softer US inflation eased direct expectations for another near-term rate hike. Lingering tensions in the strait of Hormuz have led to limiting kiwi upside momentum. The higher for longer Fed mantra compared to the RBNZ, could/should/maybe approach and the divergence between central banks could send the NZD further lower.
Current Level: 0.5652
Support: 0.5570
Resistance: 0.5680
Last week's range: 0.5625- 0.5740
Markets this week have centred around renewed geopolitical tensions in the Strait of Hormuz, oil prices have risen while the NZD/AUD has clocked 0.8300 (1.2050) for the first time in 6 weeks, on its way to 0.8335 (1.1995) this morning. There is a chance the kiwi has become a little overbought in the aftermath of the RBNZ hike last week, we are mindful of a potential pullback. With no data on the economic docket this week the cross could get its cues from central bank headlines and risk sentiment.
Current Level: 0.8315
Support: 0.8245
Resistance: 0.8350
Last week's range: 0.8188-0.8325
Current Level: (1.2018)
Support: (1.1980)
Resistance: (1.2130)
Last week's range: (1.2012-1.2212)
The New Zealand Dollar (NZD) has received a whole lot more support since last week’s raise to the RBNZ cash rate (2.25% to 2.50%) coming off mid week’s 0.4250 (2.3530) to retrace prior week’s losses to 0.4350 (2.3140) this morning. We view the area around 0.4315 (2.3180) as heavy resistance and an over-bought zone, we expect a push back towards 0.4290 (2.3300) this week. No tier 1 data prints this week in the cross except UK GDP m/m for May forecast to show 0.0% which shouldn’t move the cross much, geopolitical headlines will provide the drivers.
Current Level: 0.4308
Support: 0.4275
Resistance: 0.4315
Last week's range: 0.4249-0.4307
Current Level: (2.3212)
Support: (2.3170)
Resistance: (2.3400)
Last week's range: (2.3216-2.3534)
The New Zealand Dollar (NZD) extended momentum to 0.5065 (1.9740) in morning trade against the Euro (EUR) after trading at 0.4975 (2.0100) at the same time last week. A softer Eurozone policy tone and a hawkish RBNZ have turned the tables in the cross of late. German and French CPI reading have reinforced expectations the Eurozone central bank could be nearing the end of its tightening cycle. The next target for the kiwi on the topside is 0.5100 (1.9600), a breakthrough this zone and we could see further upside develop.
Current Level: 0.5055
Support: 0.5000
Resistance: 0.5076
Last week's range: 0.4971-0.5055
Current Level: (1.9782)
Support: (1.9700)
Resistance:(2.0000)
Last week's range: (1.9779-2.0133)
The Australian Dollar (AUD) started the week on the back foot against the US Dollar (USD) coming off 0.6950 to fall to 0.6910 as I write. Markets have turned risk averse around the NY close with the conflict in the Strait of Hormuz back on. Recently the AUD has been underpinned by a soft USD and improved strength in the Chinese Yuan, but this phase looks to have ended with punters choosing the greenback. US Inflation prints tomorrow and is expected to come in lower, but we are not sold on this view. If we see a spike the Fed will have no choice to review policy and may need to raise sooner. With markets now heavily “risk off” we could see the Aussie take a look at the long-term support at 0.6830- a level not seen since January.
Current Level: 0.6918
Support: 0.6830
Resistance: 0.7060
Last week's range: 0.6905- 0.6969
Click here for AUDUSD charts
The British Pound (GBP) has been reasonably well supported of late against the Australian Dollar in a softer Aussie backdrop. Markets welcomed the arrival of the new Prime Minister Andy Burnham viewing his presence as UK supportive with the IMF upgrading UK’s growth outlook. Investors are also continuing to buy the Pound with the hawkish Bank of England (BoE) compared to many other central bank policies. Prices hover around the 0.5185 (1.9290) zone into Tuesday, a daily close through 0.5170 (1.9350) could signal further downside for the Aussie.
Current Level: 0.5181
Support: 0.5165
Resistance: 0.5235
Last week's range: 0.5166-0.5201
Current Level: (1.9301)
Support: (1.9100)
Resistance: (1.9360)
Last week's range: (1.9227-1.9355)
The Australia Dollar (AUD) has been underpinned over the past couple of weeks by improved risk sentiment coming off 0.6020 (1.6620) to trade to 0.6100 (1.6400) Monday. As markets digested the broader conflict in the Strait of Hormuz and the Trump- blockade on Iran markets are starting to turn to the Euro. The US said it would impose a 20% safe travel tariff on all ships passing through the Strait. We pick a retest of the zone around 0.6060 (1.6500) over the week.
Current Level: 0.6076
Support: 0.6025
Resistance: 0.6135
Last week's range: 0.6056-0.6093
Current Level: (1.6458)
Support: (1.6300)
Resistance: (1.6600)
Last week's range: (1.6412-1.6511)
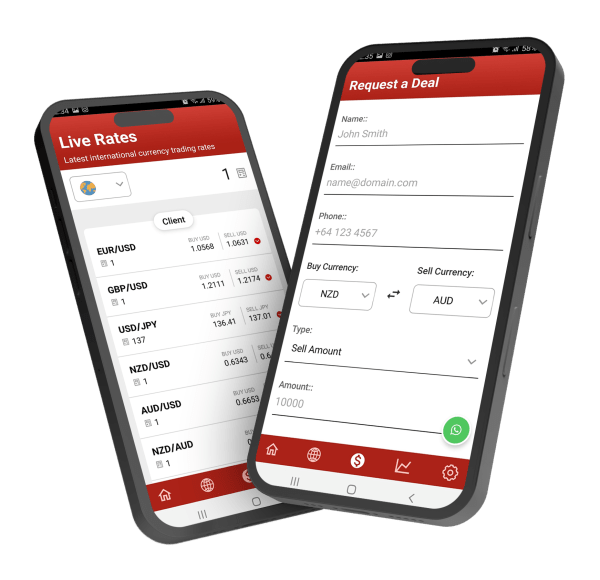
The Direct FX app has been updated to include currency charts and the highs/lows for the past 24 hours. Along with our regular market commentary, the Direct FX app also has live indicative market mid rates and a currency conversion calculator. Use the relevant link below to take you directly to the version for you, or simply search for it in the App store / Play store.